Data grid
A spreadsheet-grade grid for 100,000 rows: sorting, filters, resizable and pinned columns, selection, keyboard editing and CSV export.
What it does
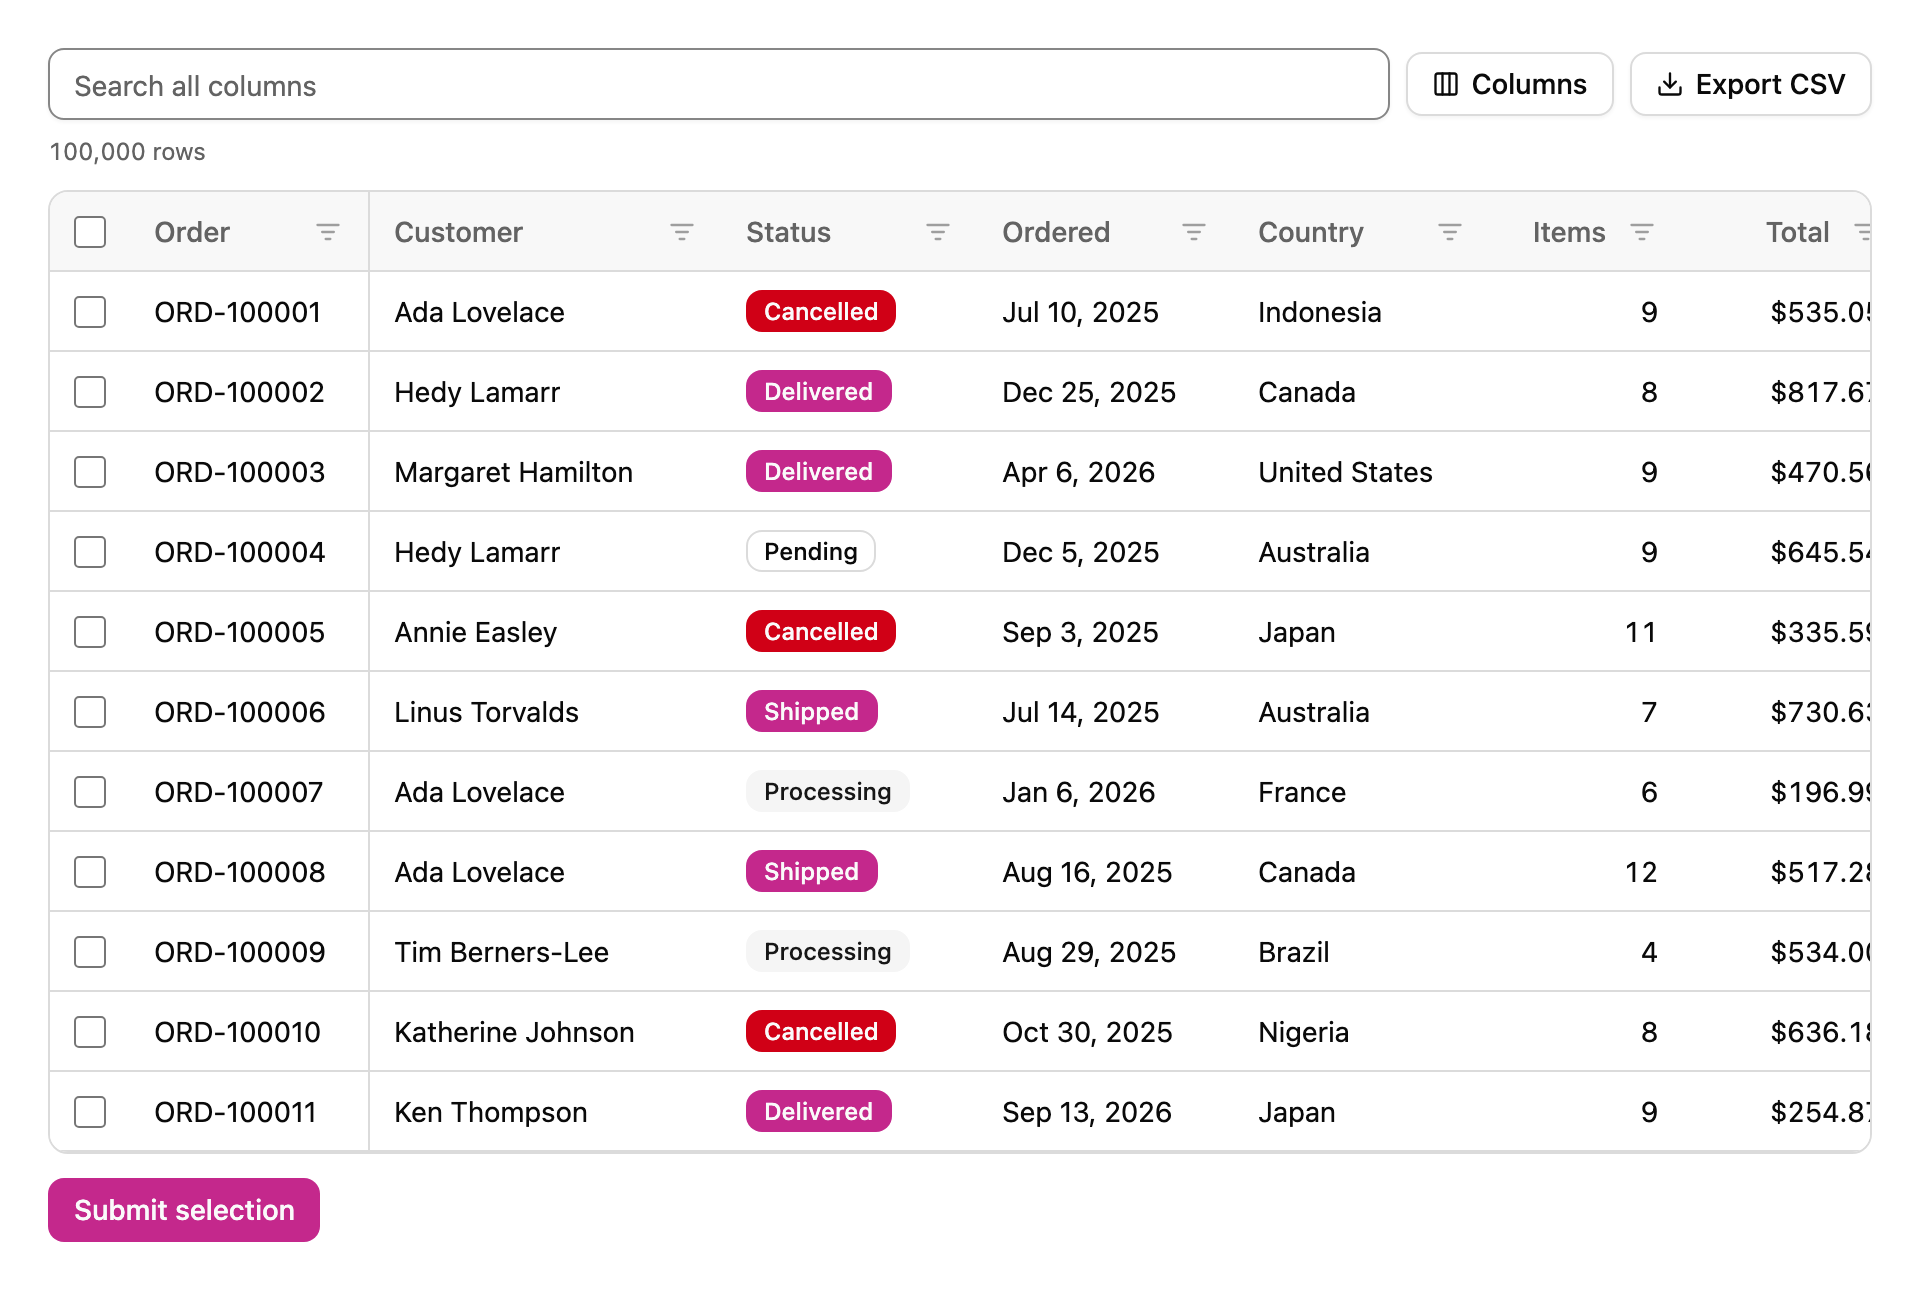
The data grid shows large tables of records the way a spreadsheet does, and stays fast with 100,000 rows in the browser. It only builds the rows you can see, plus a few above and below, and reuses them as you scroll, so the page holds a few dozen rows at any time however long the list is. Scrolling from the first order to the last takes a single drag of the scrollbar.
Click a column header to sort it, click again to reverse the order, and a third time to go back to the original order. Hold Shift while you click a second header to sort by both, and the headers number themselves so you can see which sort comes first. Every column has a filter: text columns filter by "contains", number and date columns by a from and to range, and status columns by a list of their values. A search box above the grid looks through every visible column at once.
Columns that people can arrange
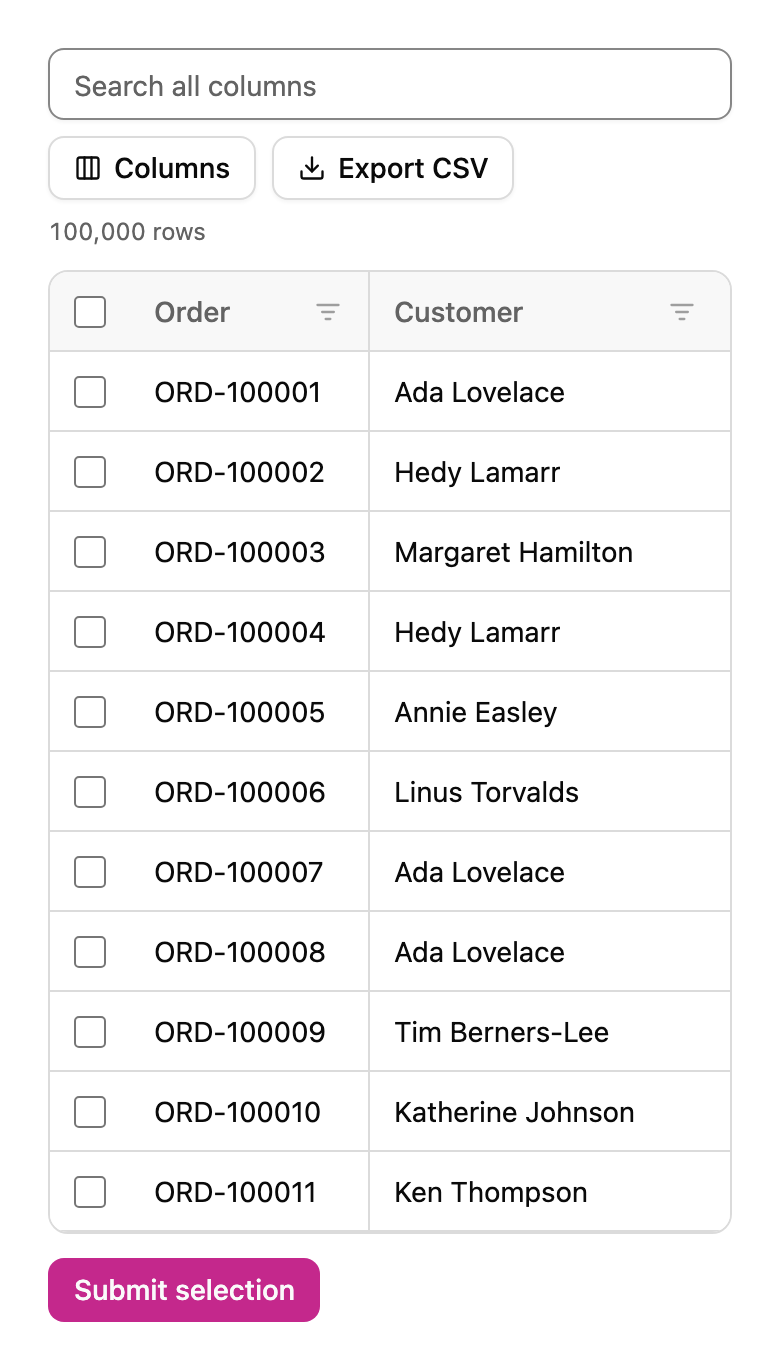
Drag the edge of a header to make a column wider or narrower, or drag the header itself to move the column. Pin a column to the left or right from the Columns menu and it stays in view while the rest scroll sideways, which keeps the order number next to its details on a phone. The same menu hides and shows columns. Export CSV downloads exactly what is on screen: the visible columns in their current order, with the active filters and sort.
Selection, editing and forms
Tick the boxes to select rows, Shift-click to select a range, or use the box in the header to select every row that matches the current filters. Put the grid inside a form with a name and it submits the ids of the selected rows, like a list of checkboxes would, and a form reset clears the selection. Columns marked as editable open an input on Enter or a double click. Enter saves, Escape cancels, and the grid sends a celledit event that your code can cancel to reject the change.
Keyboard and screen readers
The grid follows the ARIA grid pattern. One cell is in the tab order at a time; the arrow keys move between cells, Home and End go to the ends of a row, Ctrl+Home and Ctrl+End to the first and last cell, and Page Up and Page Down move by a screen of rows. Space selects a row and Enter sorts a focused header. On a header, Alt with the arrow keys resizes the column, Alt+Shift moves it, and Alt+Down opens its filter. Screen readers hear the real row count and position even though most rows are not on the page.
Your own data
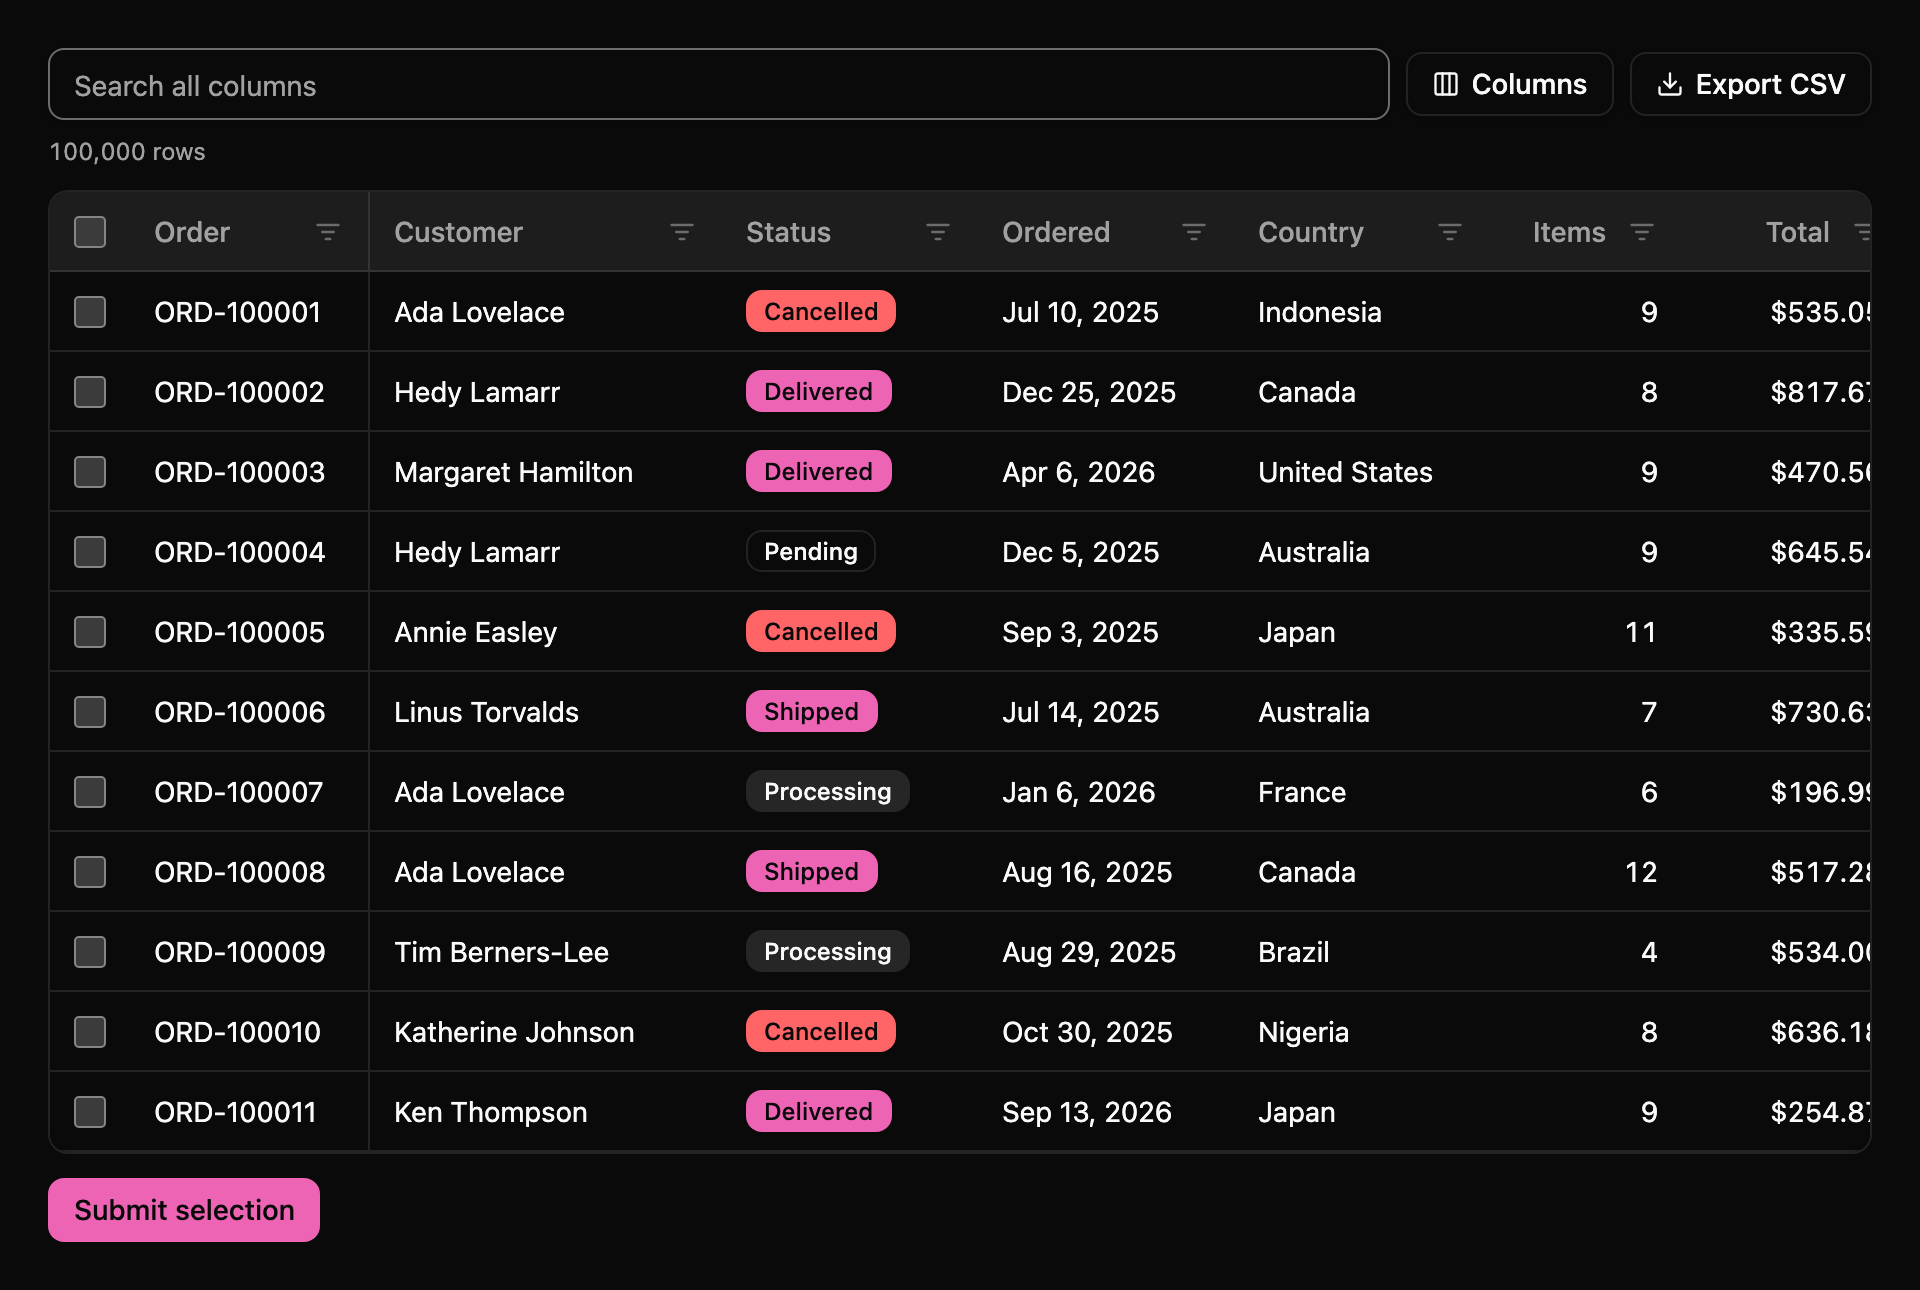
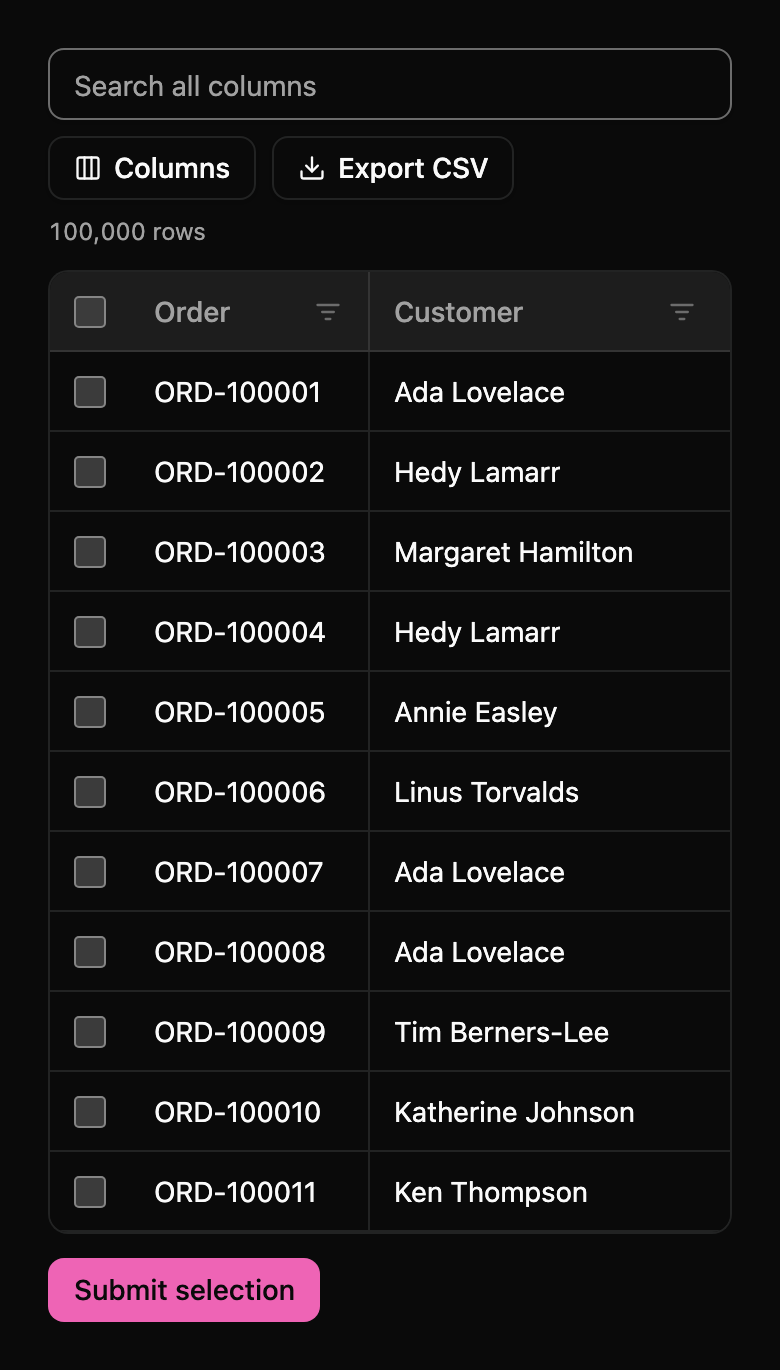
Pass the columns as a list of objects with a field, a header and optional type, width, pinning, alignment, badge colours and a named format such as currency or percent. Set rows to an array, or set src to an address and the grid asks your server for blocks of rows as people scroll, sending the sort, filters, search text, offset and limit, and expecting the rows and the total back. Listen for sortchange, filterchange and selectionchange to keep the rest of your page in step. Colours, spacing and type come from your REALM UI theme, including dark mode.
Built from REALM UI
Data grid is made from free REALM UI components, so it follows your theme and dark mode like the rest of your page:
Use it
Data grid is part of REALM Pro. Add it from REALM Pro Studio, or copy the file into your project and load it:
<import-element from="/pro/components/ui-kit-data-grid.html"></import-element>
<ui-kit-data-grid></ui-kit-data-grid>Updated · Edit this page on GitHub · View as Markdown